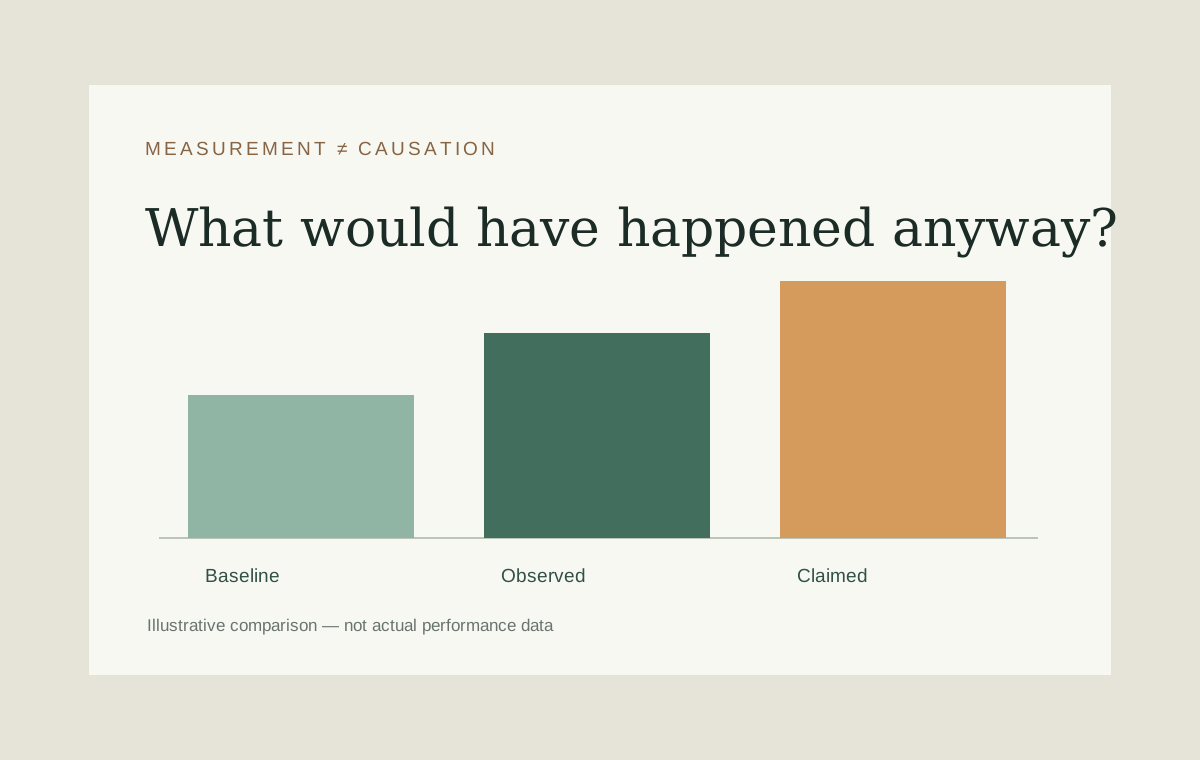
Editorial sample: This article is a design and publishing example. Perry should replace or approve it before connecting the production domain. It contains no firsthand claims or client data.
A campaign dashboard is good at showing movement. It is less good at telling you what caused that movement. If cost per acquisition rose after a budget change, the timing matters, but the budget change is only one possible explanation.
Start with the observation
Write down the exact metric, the time window, and the size of the change. Then check whether the underlying volume is large enough to interpret. A swing based on three conversions deserves a different response from a swing based on three hundred.
Ask whether the comparison periods are alike. Day of week, seasonality, promotion schedules, tracking changes, and changes elsewhere in the business can all affect what appears in the dashboard.
Separate evidence from explanation
The useful discipline is to keep three statements distinct:
- Observed: what the dashboard records.
- Supported: what a comparison or experiment can reasonably show.
- Suspected: a possible explanation worth testing.
That distinction can keep a team from turning a plausible story into a confident conclusion too early.
A question worth asking: what evidence would make me change my mind about this explanation?
Decide what to investigate next
Look for changes in traffic mix, conversion tracking, offer, landing page, and sales follow-up. Check the metric closest to the business outcome, not only the metric that is easiest to see. If the decision is consequential and the conditions allow it, plan a controlled test.
The goal is not to delay every decision until certainty arrives. It is to make the next decision with a clear view of what is known, what is uncertain, and what you can learn next.